The population in the Russian Federation is 142 million people.(as of April 2009). Over the past 7 years, Russia has lost 2 million people and moved from seventh to ninth place in the world among the largest countries by population.
The current demographic situation in Russia is characterized by depopulation, a decrease in the birth rate and an increase in mortality, an aging population, a decrease in average life expectancy, and problems in the employment of the population. The demographic factor influences the formation of labor potential and largely determines the development and distribution of the country's productive forces.
Population is a complex collection of people living within certain territories. It is characterized by a system of indicators such as population size and density, its composition by gender, age, nationality, language and education.
The presence of a certain number of people is one of the important conditions for the material and social life of society. Russia is a relatively sparsely populated country. Population density of the Russian Federation 8.3 people/km 2, which is 14 times lower than in the European Union, with 79% of the population living in the European part of Russia.
Population dynamics
In 2009, for the first time in 17 years, starting in 1993, the population in Russia stopped declining, stopping at 141.9 million people. In the 1990s. This process could not be stopped even by large immigration; the natural population decline was enormous (0.96 million people in 2000 alone) due to a sharp rise in mortality (by one and a half times) and a sharp drop in the birth rate (by one third). But what emerged in the first years of the 21st century. a decrease in the size of natural population decline (to 0.249 million people in 2009 due to a partial improvement in mortality and birth rates), coupled with migration growth that began to grow again, made it possible in 2009 to maintain the population size with the possible prospect of stabilization in the coming years (if judged by the average version of the forecast of the Federal State Statistics Service on the estimated population size until 2030).
As can be seen from table. 12.1, in Russia the birth rate has not fallen so much (it is already close to the pre-reform level and higher than in most European countries), but the mortality rate has increased significantly and continues to remain at a very high level. It is provoked by the high stress that the population continues to experience. According to a survey of the adult population conducted by Rosstat in the summer of 2008 (i.e., even before the start of the crisis), 72% of respondents experienced a feeling of great or very great anxiety about the uncertainty of their situation (however, in 1998 this was 95%), 45% of respondents assessed their level of material wealth below the poverty line (when, at best, there is only enough money for basic food and clothing), 44% were afraid of losing their jobs, and 27% experienced a feeling of loneliness.
Table 12.1. Demographic indicators of Russia
|
2015, average forecast option (low and high forecast options in brackets) |
2025, average forecast option (low and high forecast options in brackets) |
||||||
|
Population, million people (at the end of the year) |
141,7 (139,6-142,6) |
140.7 (132.6-145,5) |
|||||
|
Natural population growth/decrease. million people |
0.348 (-0,688-0.211) |
0,639 (-1,181-0.217) |
|||||
|
Birth rate, per 1000 people |
11,9 (10,9-12,5) |
||||||
|
Mortality rate, per 1000 people. |
14,4 (15,8-14,0) |
13,9 (17,0-13,2) |
|||||
|
Migration growth, million people |
|||||||
|
Life expectancy at birth, years |
69,8 (67,9-70,3) |
72,4 (68,2-75,0) |
|||||
|
Including: men |
63,4 (61,8-64,4) |
66,7 (62,3-70,7) |
|||||
|
75,7 (74,3-76,2) |
77,9 (74,4-79,3) |
||||||
|
Average annual working age population, million people. |
82,7 (82,2-83,0) |
76,7 (74,5-78,2) |
Severe socio-economic stress causes anomie, primarily in the most active part of the population - men (especially in the group from 30 to 50 years old). Anomie manifests itself, in particular, in neglect of one’s own and others’ lives. As a result, the working age population has a very high mortality rate from external causes and chronic diseases. Thus, more than 30% of mortality falls on external causes - these are accidental poisonings (mainly with low-quality alcohol), suicides, murders, road accidents, etc. The high mortality rate of the working-age population from cardiovascular diseases (it is 3-4 times higher than in European countries, and it accounts for 55% of the causes of death) is mainly a consequence of the fact that the proportion of those who take care of their health (through diet, refusal from bad habits, medical prevention) does not exceed 25% of those surveyed by Rosstat.
The Concept of demographic policy of the Russian Federation for the period until 2025, approved at the end of 2007 by decree of the President of the Russian Federation, states that the goals of demographic policy are to stabilize the population by 2015 at the level of 142-143 million people and create conditions for its growth by 2025 . up to 145 million people, as well as improving the quality of life and increasing life expectancy by 2015 to 70 years, by 2025 - to 75 years. In fact, the Concept orients the country towards the high version of Rosstat’s forecast on the estimated population size.
Population aging
If Russia at the end of the 19th century was a country with a young population - with a high proportion of children and a low proportion of elderly people, then after 1959 the proportion of elderly people in the total population began to increase. But when compared with other countries with low birth rates, it turns out that Russia’s population is not the oldest. In 1990, Russia ranked 25th. This is not surprising, since Russia, firstly, is at the stage of the aging process, when the proportion of the middle-aged population remains virtually unchanged and aging occurs due to a decrease in the proportion of children, and secondly, due to low life expectancy, not all people live to old age.
The highest proportion of teenage children is in the Republics of the North Caucasus, in the national formations of Siberia and the Far East.
The lowest proportion of the young population is in the North-West of the country.
Urbanization of population
— growth in the share of urban population
At the moment there are 1096 cities in Russia, of which 11 are millionaire cities:
Millionaire cities Russia:
- Moscow (10,500 thousand people)
- St. Petersburg (4,581)
- Novosibirsk (1,398)
- Ekaterinburg (1,335)
- Nizhny Novgorod (1,280)
- Samara (1,135)
- Kazan (1,130)
- Omsk (1,129)
- Chelyabinsk (1,093)
- Rosnov-on-Don (1,049)
- Ufa (1,032)
Quantity urban population in Russia is 73% .
79% of residents live in the European part of Russia.
Russians make up 80% of the country's population.
Cities that changed their names after the 90s:
- St. Petersburg (Leningrad)
- Nizhny Novgorod (Gorky)
- Ekaterinburg (Sverdlovsk)
- Samara (Kuibyshev)
Factors influencing population size
Let's look at the factors influencing population size.
The dynamics of the population of any state consists of natural and mechanical movement of the population.
Natural population movement
FertilityNatural population movement is a change in population under the influence of natural processes (fertility and mortality) that determine the change of human generations.
The birth rate in Russia is 12 ppm, which means 12 people per thousand people (data for 2009) (in 2002, 10 people per 1000 people.)
In recent years, the situation has improved somewhat, which is due to the government's active demographic policy. However, the annual natural population decline remains quite high, and the migration growth of the population has decreased significantly.
Factors influencing fertility:
- standards of living
- national characteristics
- woman's education level
- state of the country's healthcare system
The highest birth rates are in the republics of the Volga-Vyatka, North Caucasus and Ural economic regions.
The lowest birth rate is in the Northwestern and Central economic regions.
MortalityThe mortality rate in Russia is 15 people per 1000 people. The mortality rate among Russian men and women of working age is significantly higher than the European average.
In Russia formed special mortality pattern:
- A huge gap in the average life expectancy of men and women (13 years). On average, men live to 61 years, women to 74 years.
- Decrease in life expectancy
- Changes in the structure of causes of mortality:
- Digestive diseases
- Cancers
- Territorial factor
- Poisoning, AIDS, suicide
In Russia, the region with the highest mortality rate is the Pskov region.
Mechanical movement of population
Mechanical movement of population- movement of people for permanent or temporary residence due to natural, economic, political and other reasons.
Internal movements do not change the population of a country, but change the population of individual areas. Currently, internal migration covers 80% of the total migration turnover.
Internal migration It happens:
- permanent (moving to permanent residence)
- seasonal (movement depending on the time of year)
- pendulum (regular, usually daily, movements of the population from one locality to another to work or study and back)
- And also a rotation system characteristic of the northern regions of western and eastern Siberia was formed
External migration divided into:
- Immigration (entry of citizens into the country)
- Emigration (departure of citizens from their country to another country for permanent or long-term residence)
January 1, 2002"- statistical bulletin (published since 1992), contains data on the population of the Russian Federation and its constituent entities. Information is presented for the permanent population, divided into urban and rural. The data is presented by gender, one-year age group and various age groups: for example, the population size for the main age groups is younger than working age, working age, older than working age, as well as their share in the total population. Age groups are distinguished by the number of children, youth and older ages. Data are provided on the ratio of men and women, the average age of the population and the indicator of the demographic burden of children and people of retirement age to the working age population.
"Natural movement of the population of the Russian Federation"- quarterly statistical bulletin, contains absolute and relative indicators characterizing the natural movement of the population in the Russian Federation and its constituent entities (fertility, mortality, divorce, mortality by cause, infant mortality). Data are published in comparison with the corresponding period of the previous year.
“Population survey on employment problems”- quarterly statistical bulletin, prepared on the basis of data obtained by state statistics bodies when conducting sample surveys of the population on employment issues (labor force surveys). The bulletin contains information about the basic principles of the survey, concepts and definitions used when publishing its results, includes indicators of the accuracy of assessing the survey results, an analysis of the current state of economic activity of the population and detailed statistical materials on the survey results. The bulletin contains data characterizing the number and composition of the economically active population, employed and unemployed, the level of economic activity of the population and unemployment, working hours, and the main characteristics of the economically inactive population. Most statistical data are presented in dynamics since the beginning of the
statistical observation - since 1992. Data for the regions of the Russian Federation are compiled based on the results of four quarterly samples and are characterized by average indicators for the period from February to November. The results of the survey for the regions of Russia were compiled in relation to the place of residence 9.
Several journals publishing works on statistics are published abroad, including Annals of Statistics (until 1973 Annals of Mathematical Statistics), International Statistical Institute Review, Biometrika, Journal of the Royal Statistical Society. There are scientific associations that support this type of research. An important role is played by the International Statistical Institute (ISI), headquartered in Amsterdam, and the International Association for Statistical Methods in the Natural Sciences (IASPS), which was created under it. Statistical Science is the organ of the American Institute for Mathematical Statistics, publishing articles in many fields of knowledge, provided that they reflect the application of the methods of mathematical statistics to various questions of science and technology. The relatively few regular readers of this journal are mainly university professors and researchers interested in statistical research methods.
The population has gender, age, ethnicity and...
Characterized by a demographic pyramid. The demographic pyramid shows the quantitative distribution of the country's population (based on census results or statistical calculations) by gender and age composition at a certain point in time.
The modern demographic pyramid of Russia was influenced by demographic crises. As a result, the demographic pyramid has periods of sharp population decline: 1918-1919, 1935-1936, 1943-1946, 1968-1972, 1993-1996. In addition, the demographic pyramid of Russia shows a gender imbalance: men predominate under the age of 29, between the ages of 30 and 44 the number of men and women is approximately equal, and over the age of 44 women predominate over men, reaching an excess of 3 or more times in aged over 70 years.
Features of gender composition make it possible to divide all countries of the world into three groups:
- the first group includes those countries where the number of men and women is equal (these include countries in Africa and Latin America);
- the second group includes countries with a predominance of female populations (these include half of all countries in the world, and this excess is especially typical for European countries, where a significant imbalance in sexual balance occurred during the years of the world wars);
- the third group includes countries with a predominant male population (especially typical for Asian countries, and primarily for India and China).
The gender and age structure of the Russian population is constantly under the influence of demographic shocks. In general, due to the significant difference in male and female life expectancy, there is a slight preponderance of women in the population structure.
The main problems of Russia's demographic development can be considered the reduction in the total population and its irrational structure.
Russia is located in the process of population aging, when the share of the middle-aged population remains virtually unchanged (or even increases), aging occurs due to a decrease in the share of children.
According to forecasts of the Russian Academy of Sciences, by 2016, elderly people over 65 years of age will already make up 20% of the total number of Russians, and children under 15 years old - 17% (this group may grow due to an increase in the birth rate). As a result, the share of the working age population in the population structure will decrease. The consequences of this crisis can be catastrophic from an economic point of view, this is a reduction in per capita income (in 2016 there will be one dependent for every worker).
Ethnic structure of the Russian population
Ethnic structure of the population characterized by national composition. A people is a historically established community of people, differing in language, way of life, customs, historical traditions, culture, as well as in labor skills and territorial community.
By linguistic affiliation, the peoples of Russia belong to four language families: Indo-European (89%) - Slavic, Germanic, Iranian, Romanov groups; Altai (6.8) - Turkic, Mongolian groups; Caucasian (2.4) - Abkhaz-Adyghe, Nakh-Dagestan groups; Ural (1.8%) - Finno-Ugric, Samoyed groups.
Language families include language groups. In the Indo-European family, the largest group is Slavic. The Chukchi-Kamchatka language family is extremely small; it includes the Chukchi, Koryaks, and Itelmens. There are even fewer Eskimos and Aleuts. Some small peoples (Kets, Nivkhs) do not belong to any of the existing language families and stand out as isolated. The rapid pace of urbanization, migration processes and the increase in the number of interethnic marriages contributed to assimilation and integration processes.
The original Russian regions in Russia are territories stretching from the European North, North-West to the central regions of Russia. The Russian population also predominates in the regions of the Urals, southern Siberia and the Far East. Russia as a whole is characterized by a diversity of national composition in several regions. Multinational regions:
- regions along the Volga and Kama (Chuvash, Mordovian, Tatar, Bashkir, Udmurt republics, Mari El, Kalmykia republics);
- Northern Caucasus - seven republics: Karachay-Cherkessia, Kabardino-Balkaria, North Ossetia-Alania, Ingushetia, Adygea, Chechen, Dagestan;
- certain regions of the East and North (Altai Mountains, Khakassia, Buryatia, Tyva, Yakutia - republics of the Eastern macroregion: the peoples of the North inhabiting the republics of Karelia, Komi; autonomous districts of Russia).
According to the Constitution of 1993 in the Russian Federation, 32 were allocated on a national basis (21 republics, 10 autonomous okrugs and 1 autonomous region). The total area of 32 national entities accounted for 53% of the territory of Russia. However, it should be remembered that in modern conditions there is a gradual transformation of the political map of Russia. The need for a transition from a national-territorial administrative structure to an economic one is obvious. As a result of the merger of the subjects of the Federation, the number of autonomous okrugs was reduced to four, i.e. in 2010, the number of subjects of the Federation allocated on the basis of nationality was 25.
All national entities have a complex population composition. However, the share of the titular nation is in some cases relatively small. Only in 9 subjects of the Federation the share of the titular nation exceeds 50%: in Ingushetia - 74.5; Kabardino-Balkaria - 57.6; North Ossetia-Alania - 53.0; Chechnya - 66.0; Chuvashia - 67.8; Tyva - 64.3; Aginsky Buryat Autonomous Okrug - 54.9%; in multi-ethnic Dagestan, ten local peoples (Avars, Dargins, Kumyks, Lezgins, Laks, Tabarasans, Nogais, Rutuls, Aguls, Tsakhurs) form 80% of the total population. The lowest share of the titular nation is in the Khanty-Mansiysk Autonomous Okrug - 1.6%; in the Jewish Autonomous Region - 4.2; in the Yamalo-Nenets Autonomous Okrug - 6.1; in the Chukotka Autonomous Okrug - 7.3; in Karelia - 10.0%.
- 240.50 KbIn the discipline "Economic Geography and Regional Studies"
Sex and age composition of the population of the Russian Federation
(abstract)
- ACUTE PROBLEMS AND DIRECTIONS FOR OPTIMIZING THE AGE AND SEX STRUCTURE OF THE RUSSIA POPULATION
One of the main tasks of the Government of the Russian Federation is the transition to an innovative economy and increasing its efficiency. One of the main difficulties on this path is the deterioration of the demographic situation in the country. The abstract analyzes the age-sex structure of the population of the Russian Federation.
In Russia, unfortunately, the male “super-mortality rate” in working ages is very high.The main reason for the Russian “female advantage” is the Second World War and the associated huge losses of male generations. Naturally, as the war recedes into the past, the sex ratio levels out. An important feature of long-term changes in the Russian age pyramid, deformed by wars and social upheavals, is the gradual weakening of gender imbalance.
All post-war population censuses showed a steady decline in the “female preponderance” in the population; the number of women per 1,000 men in the population as a whole was steadily declining: in 1959 - 1,242; in 1970 - 1193; in 1979 - 1174; in 1989 - 1140. The 2002 census for the first time showed an increase in this ratio (Fig. 1).
Figure 1. Number of women per 1000 men according to population census data
According to the latest population census, as of October 9, 2002, there were 67,605 thousand men and 77,562 thousand women living in the Russian Federation; by the beginning of 2004, the number of men and women had decreased to 67,024 and 77,144 thousand people, respectively, and the sex ratio in the total population had increased from 1,147 to 1151 women per 1000 men.
Thus, over the past century, the share of women in the total population of Russia increased from 51.3% in 1897 to 55.4% in 1959, then decreased - to 53.3% in 1989 - and increased again - to 53.5 % compared to the beginning of 2004.
Figure 2.
Number of men and women in Russia, according to censuses and current records, millions of people
The predominance of the number of women over the number of men develops in middle ages as a result of different rates of extinction of the female and male populations (for certain territories, migration processes may also have a certain significance) and increases during the transition to older age groups. In the post-war years, the “female predominance” was already noted in young groups - starting from 25-29 years old, and in the ages of 35 years and older it became especially obvious. In subsequent years, gender disproportion increasingly shifted to older age groups. Thus, according to the results of the 1989 census, the excess of the number of women over the number of men was noted starting from 35-39 years old and became noticeable starting from the age group of 60-64 years - the generations that suffered most during the war. The results of the 2002 census show that the gender imbalance has once again become younger. The biologically predetermined excess of the male population over the female population has already been exhausted in the group of 25-29 years. At the age of 30 years and older, there are more and more women compared to their male counterparts - due to the higher mortality of the latter.
Compared to the male population, among the female population there is a higher proportion of older people and a lower proportion of younger people. The median age of women in Russia in 2002 was 39.8 years, and for men - 34.1 years.
The ratio of women and men varies markedly across Russian regions. According to current accounting data at the beginning of 2004, in 44 regions of the Russian Federation the ratio of men to women corresponded to the national average or exceeded it, and in some quite significantly. In the Vladimir, Ivanovo, Nizhny Novgorod, Novgorod, Smolensk, Tver, Tula and Yaroslavl regions, as well as in St. Petersburg, there were from 1205 to 1238 women per 1000 men. But in other regions, the female predominance was not so significant, and in three regions - the Kamchatka region, Chukotka and Yamalo-Nenets Autonomous Okrug, men predominated (926-996 women per 1000 men), and in three more - Koryak, Nenets and Evenki the number of men equal to the number of women.
Regions with younger populations have lower gender disproportion, which naturally follows from the nature of gender asymmetry in the Russian age-sex pyramid. Accordingly, the gap in the average age of living men and women is significantly smaller where the gender disproportion is smaller. This gap is maximum in the Central and Northwestern federal districts, minimum in the Far East.
During the intercensus period, the number of men per 1000 women decreased noticeably in the North and East of the country, i.e. in those regions where, during the 1989 census, it was noticeably higher than in other regions of Russia. Apparently, this is due to the outflow of working-age men from these areas, who were previously attracted to these areas by more favorable working conditions, which subsequently changed during the transition to a market economy.
At the same time, in 18 federal subjects there was a noticeable increase in the number of men per 1,000 women. Among them are Moscow, the Komi-Permyak Autonomous Okrug, the Republics of Adygea, North Ossetia, Dagestan, where the increase was more than 20 points and was the result of either significant entry (Moscow) or a relatively high birth rate (republics of the North Caucasus).
Age is the most important characteristic of any demographic events, determining the frequency (intensity) of their occurrence. Data on the age of onset of certain demographic events make it possible to analyze both demographic processes and the reproduction of the population as a whole, identifying their features and patterns at various stages of the human life cycle.
The age structure of the population influences social processes in individual territories. It has a natural impact on the natural movement of the population, which is expressed by indicators of fertility, mortality, and marriage rates. The higher the proportion of young people in the population, the higher the overall fertility and marriage rates calculated for the entire population of the territory. The higher the proportion of older people, the higher the overall mortality rate.
Information about the age structure of the population is obtained during the census, special surveys, as well as current records of demographic events.
Thus, knowing the features of the age structure of the population at a certain point in time, it is possible to build fairly conditional statements about future trends in fertility and mortality and other demographic processes, as well as the reproduction of the population as a whole, assess the likelihood of certain problems arising in the economic and social spheres, and forecast demand for certain goods or services.
According to the 2002 census, noticeable changes have occurred in the age composition of the population. The sharp decline in the birth rate, which began in the late 80s and early 90s of the last century, led to an intensification of the process of demographic aging. Compared to the 1989 census. The average age of the country's residents increased by 4.3 of the year and amounted to 37.1 years. For men, by 3.6 years and 34.1 years, respectively, for women, by 4.6 years and 39.8 years.
Table 1
Population by age group
| Thousand people | Share of the population of the corresponding age group | |||||||
| 1989 | 2002 | |||||||
| husband. and wives | including | husband. and wives | including | |||||
| husband. | wives | husband. | wives | in total population, % | ||||
| 1989 | 2002 | |||||||
| Whole population | 147022 | 68714 | 78308 | 145167 | 67605 | 77562 | 100 | 100 |
| including in age, years: |
||||||||
| 0-9 | 23392 | 11897 | 11495 | 13340 | 6825 | 6515 | 15,9 | 9,2 |
| 10-19 | 20560 | 10491 | 10069 | 23207 | 11817 | 11390 | 14,0 | 16,0 |
| 20-29 | 22312 | 11330 | 10982 | 22079 | 11097 | 10982 | 15,2 | 15,2 |
| 30-39 | 24547 | 12294 | 12253 | 20052 | 9939 | 10113 | 16,6 | 13,8 |
| 40-49 | 15618 | 7543 | 8075 | 24153 | 11578 | 12575 | 10,6 | 16,6 |
| 50-59 | 17992 | 8173 | 9819 | 15419 | 7008 | 8411 | 12,2 | 10,6 |
| 60-69 | 12870 | 4608 | 8262 | 14328 | 5695 | 8633 | 8,8 | 9,9 |
| 70-79 | 6986 | 1830 | 5156 | 9809 | 3070 | 6739 | 4,8 | 6,8 |
| 80 years or more | 2660 | 508 | 2152 | 2660 | 516 | 2144 | 1,8 | 1,8 |
| Of the total number - population aged: |
||||||||
| younger than able-bodied (men and women up to 16 years old) |
35995 | 18288 | 17707 | 26327 | 13452 | 12875 | 24,5 | 18,1 |
| able-bodied (men 16-59 years old, women 16-54 years old) |
83746 | 43440 | 40306 | 88942 | 44812 | 44130 | 56,9 | 61,3 |
| older than able-bodied (men 60 years or more, women 55 years or more) |
27196 | 6946 | 20250 | 29778 | 9281 | 20497 | 18,5 | 20,5 |
During the intercensus period, the population over working age increased by 2.6 million people (9.5%). At the same time, the number of children and adolescents during this period decreased by 9.7 million people (27%). A particularly sharp decline (by 43%) occurred in the age group of children under 10 years old (generations born in the last decade, when the birth rate was the lowest in the entire post-war history of Russia). The entry into working age of the generation of young people born in the first half of the 80s of the last century (the period of the highest birth rate in the last three decades), as well as positive migration growth, led to an increase in the working age population by 5.2 million people (by 6 %). Structural changes have also occurred within this age group. In 2002 52.6% of the working-age population were people over 35 years of age (in 1989 - 45.7%).
According to the 2002 census, 73% of Russians are urban residents, 27% are rural. This ratio was the same according to the previous population census in 1989. One of the main features of the demographic situation in the country in recent decades is the concentration of the urban population in a small number of densely populated centers. More than 60 percent of Russia's population is concentrated in three federal districts - Central (26%), Volga (22%) and Southern (16%). The smallest is the Far Eastern Federal District - 4.6% of the population. A third of Russia’s residents are concentrated in the largest “millionaire cities”: Moscow, St. Petersburg, Novosibirsk, Yekaterinburg, Nizhny Novgorod, Samara, Omsk, Kazan, Chelyabinsk, Rostov-on-Don, Ufa. Moscow is one of the 20 largest cities in the world.
The age composition of the urban and rural populations historically has some differences, which reflect the features of the urbanization process in Russia, as well as differences in reproductive behavior and life expectancy of urban and rural residents.
table 2
Age composition of urban and rural populations
| Urban population | Rural population | |||||||
| thousand people | in % of total | thousand people | in % of total | |||||
| 1989 | 2002 | 1989 | 2002 | 1989 | 2002 | 1989 | 2002 | |
| Whole population | 107959 | 106429 | 100 | 100 | 39063 | 38738 | 100 | 100 |
| including aged: |
||||||||
| younger able-bodied |
25693 | 18019 | 23,8 | 16,9 | 10302 | 8308 | 26,4 | 21,4 |
| able-bodied | 63618 | 67250 | 58,9 | 63,2 | 20128 | 21692 | 51,5 | 56,0 |
| older able-bodied |
18578 | 21048 | 17,2 | 19,8 | 8618 | 8730 | 22,1 | 3.1. Main trends in mortality. 21|
In general, more boys are born (approximately 106 boys per 100 girls), by the age of 25-30 the number of women and men is comparable (many representatives of the stronger sex die due to accidents, alcohol abuse, etc.), at older ages women predominate (in they have a longer life expectancy).
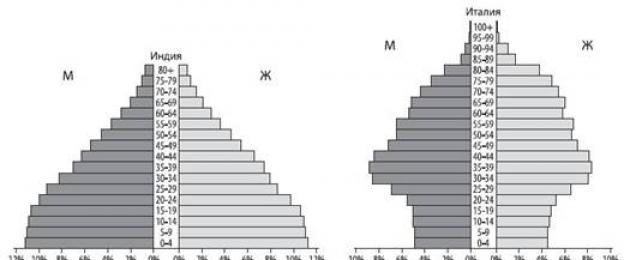
Russia is characterized by a modern type of population reproduction: low fertility and mortality rates, low natural increase, relatively high life expectancy, and a small proportion of children in the population structure. The traditional type of population reproduction is characterized by high birth rates, natural increase, and a high proportion of children in the population structure. Below are examples of a sex and age pyramid of the traditional type of population reproduction (India) and modern (Italy). Italy has similar demographic indicators to Russia (Fig. 2).

Rice. 2. Sex and age pyramids of India and Italy ()
According to the 2010 population census in Russia, 54% are women and 46% are men. The predominance of women in the population structure is associated with their longer life expectancy, specific work, genetics, and lifestyle.
An important indicator characterizing the population is the average life expectancy. Russians have a low average life expectancy, about 70 years (for women - 73 years, for men - 65 years). For comparison, in Japan, Monaco, and Switzerland, people live on average 90 years.
An important task of the state and the entire society is to reduce infant mortality and preserve the lives of children (Fig. 3).

Rice. 3. Perinatal center in Khabarovsk ()
Factors influencing life expectancy:
- Lifestyle
- Environmental factor
- Heredity
- Quality of medical care and other services to the population
In fact, everything that surrounds us can affect a person’s life expectancy: work, availability of free time, mental state, climate, self-education, family, etc. Unfortunately, unlike developed countries, residents of Russia have less developed traditions of healthy lifestyle and careful attitude towards your health (Fig. 4).

Rice. 4. Healthy lifestyle ()
In general, in most regions of Russia, women predominate in the population structure (especially in the European part of Russia). In percentage terms, there are more men in the eastern and northern regions of Russia. This is due to the fact that the conditions there are very difficult, and work requires male strength and endurance. The northern regions are areas of new development, and men go there to work.
To determine the age composition, the population is divided into three parts:
- Children and adolescents under 16 years of age (younger than working age) - 16%
- Working age population (from 16 to 59 years inclusive for men and from 16 to 54 years inclusive for women) - 62%
- Population over working age (over 60 years for men and over 55 years for women) - 22%

Rice. 5. How the age composition of the Russian population is changing ()

Rice. 6. Ratio of pensioners and able-bodied citizens ()
Bibliography
Main
- Geography of Russia: Textbook. for 8-9 grades. general education institutions / Ed. A.I. Alekseeva: In 2 books. Book 1: Nature and population. 8th grade - 4th ed., stereotype. - M.: Bustard, 2009. - 320 p.
- Geography of Russia. Nature. 8th grade: textbook. for general education institutions/ I.I. Barinova. - M.: Bustard; Moscow textbooks, 2011. - 303 p.
- Geography. 8th grade: atlas. - 4th ed., stereotype. - M.: Bustard, DIK, 2013. - 48 p.
- Geography. Russia. Nature and population. 8th grade: atlas - 7th ed., revision. - M.: Bustard; Publishing house DIK, 2010 - 56 p.
Encyclopedias, dictionaries, reference books and statistical collections
- Geography. Modern illustrated encyclopedia / A.P. Gorkin - M.: Rosman-Press, 2006. - 624 p.
Literature for preparing for the State Exam and the Unified State Exam
- Thematic control. Geography. Nature of Russia. 8th grade: textbook. - Moscow: Intellect-Center, 2010. - 144 p.
- Tests on Russian geography: grades 8-9: textbooks, ed. V.P. Dronov “Geography of Russia. Grades 8-9: textbook. for general education institutions”/ V.I. Evdokimov. - M.: Publishing house "Exam", 2009. - 109 p.
- Getting ready for the GIA. Geography. 8th grade. Final testing in exam format./auth.-comp. T.V. Abramova. - Yaroslavl: Development Academy LLC, 2011. - 64 p.
- Tests. Geography. 6-10 grades: Educational and methodological manual / A.A. Letyagin. - M.: LLC "Agency "KRPA "Olympus": "Astrel", "AST", 2001. - 284 p.
- Federal Institute of Pedagogical Measurements ().
- Russian Geographical Society ().
- Geografia.ru ().
- Wikipedia ().
- Wikipedia ().
- Federal State Statistics Service ().
- Demoscope Weekly ().
Homework
Paragraph 45, 46.
- Tell us about the age composition of the Russian population.
- In contact with 0
- Google+ 0
- OK 0
- Facebook 0