The derivative of a function is one of the tricky topics in school curriculum. Not every graduate will answer the question of what a derivative is.
This article simply and clearly explains what a derivative is and why it is needed.. We will not now strive for mathematical rigor of presentation. The most important thing is to understand the meaning.
Let's remember the definition:
The derivative is the rate of change of the function.
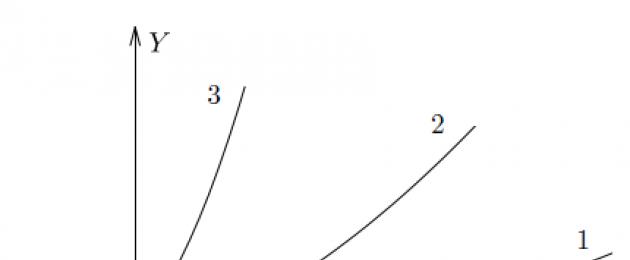
The figure shows graphs of three functions. Which one do you think grows the fastest?

The answer is obvious - the third. It has the highest rate of change, that is, the largest derivative.
Here is another example.
Kostya, Grisha and Matvey got jobs at the same time. Let's see how their income changed during the year:

You can see everything on the chart right away, right? Kostya's income has more than doubled in six months. And Grisha's income also increased, but just a little bit. And Matthew's income decreased to zero. The starting conditions are the same, but the rate of change of the function, i.e. derivative, - different. As for Matvey, the derivative of his income is generally negative.
Intuitively, we can easily estimate the rate of change of a function. But how do we do it?
What we are really looking at is how steeply the graph of the function goes up (or down). In other words, how fast y changes with x. Obviously, the same function at different points can have a different value of the derivative - that is, it can change faster or slower.
The derivative of a function is denoted by .
Let's show how to find using the graph.

A graph of some function is drawn. Take a point on it with an abscissa. Draw a tangent to the graph of the function at this point. We want to evaluate how steeply the graph of the function goes up. A handy value for this is tangent of the slope of the tangent.
The derivative of a function at a point is equal to the tangent of the slope of the tangent drawn to the graph of the function at that point.
Please note - as the angle of inclination of the tangent, we take the angle between the tangent and the positive direction of the axis.
Sometimes students ask what is the tangent to the graph of a function. This is a straight line that has the only common point with the graph in this section, moreover, as shown in our figure. It looks like a tangent to a circle.
Let's find . We remember that the tangent of an acute angle in right triangle equal to the ratio of the opposite leg to the adjacent one. From triangle:
We found the derivative using the graph without even knowing the formula of the function. Such tasks are often found in the exam in mathematics under the number.
There is another important correlation. Recall that the straight line is given by the equation
The quantity in this equation is called slope of a straight line. It is equal to the tangent of the angle of inclination of the straight line to the axis.
.
We get that
Let's remember this formula. It expresses the geometric meaning of the derivative.
The derivative of a function at a point is equal to the slope of the tangent drawn to the graph of the function at that point.
In other words, the derivative is equal to the tangent of the slope of the tangent.
We have already said that the same function can have different derivatives at different points. Let's see how the derivative is related to the behavior of the function.
Let's draw a graph of some function. Let this function increase in some areas, and decrease in others, and at different rates. And let this function have maximum and minimum points.

At a point, the function is increasing. The tangent to the graph, drawn at the point, forms an acute angle with the positive direction of the axis. So the derivative is positive at the point.
At the point, our function is decreasing. The tangent at this point forms an obtuse angle with the positive direction of the axis. Since the tangent of an obtuse angle is negative, the derivative at the point is negative.
Here's what happens:
If a function is increasing, its derivative is positive.
If it decreases, its derivative is negative.
And what will happen at the maximum and minimum points? We see that at (maximum point) and (minimum point) the tangent is horizontal. Therefore, the tangent of the slope of the tangent at these points is zero, and the derivative is also zero.
The point is the maximum point. At this point, the increase of the function is replaced by a decrease. Consequently, the sign of the derivative changes at the point from "plus" to "minus".
At the point - the minimum point - the derivative is also equal to zero, but its sign changes from "minus" to "plus".
Conclusion: with the help of the derivative, you can find out everything that interests us about the behavior of the function.
If the derivative is positive, then the function is increasing.
If the derivative is negative, then the function is decreasing.
At the maximum point, the derivative is zero and changes sign from plus to minus.
At the minimum point, the derivative is also zero and changes sign from minus to plus.
We write these findings in the form of a table:
| increases | maximum point | decreases | minimum point | increases | |
| + | 0 | - | 0 | + |
Let's make two small clarifications. You will need one of them when solving exam problems. Another - in the first year, with a more serious study of functions and derivatives.
A case is possible when the derivative of a function at some point is equal to zero, but the function has neither a maximum nor a minimum at this point. This so-called :

At a point, the tangent to the graph is horizontal and the derivative is zero. However, before the point the function increased - and after the point it continues to increase. The sign of the derivative does not change - it has remained positive as it was.
It also happens that at the point of maximum or minimum, the derivative does not exist. On the graph, this corresponds to a sharp break, when it is impossible to draw a tangent at a given point.

But how to find the derivative if the function is given not by a graph, but by a formula? In this case, it applies
First, try to find the scope of the function:
Did you manage? Let's compare the answers:
All right? Well done!
Now let's try to find the range of the function:

Found? Compare:
Did it agree? Well done!
Let's work with the graphs again, only now it's a little more difficult - to find both the domain of the function and the range of the function.
How to Find Both the Domain and Range of a Function (Advanced)

Here's what happened:
With graphics, I think you figured it out. Now let's try to find the domain of the function in accordance with the formulas (if you don't know how to do this, read the section about):
Did you manage? Checking answers:
- , since the root expression must be greater than or equal to zero.
- , since it is impossible to divide by zero and the radical expression cannot be negative.
- , since, respectively, for all.
- because you can't divide by zero.
However, we still have one more moment that has not been sorted out ...
Let me reiterate the definition and focus on it:
Noticed? The word "only" is a very, very important element of our definition. I will try to explain to you on the fingers.
Let's say we have a function given by a straight line. . When, we substitute this value into our "rule" and get that. One value corresponds to one value. We can even make a table of various values and plot a given function to verify this.
"Look! - you say, - "" meets twice!" So maybe the parabola is not a function? No, it is!
The fact that "" occurs twice is far from a reason to accuse the parabola of ambiguity!
The fact is that, when calculating for, we got one game. And when calculating with, we got one game. So that's right, the parabola is a function. Look at the chart:

Got it? If not, here's a real-life example for you, far from mathematics!
Let's say we have a group of applicants who met when submitting documents, each of whom told where he lives in a conversation:

Agree, it is quite real that several guys live in the same city, but it is impossible for one person to live in several cities at the same time. This is, as it were, a logical representation of our "parabola" - Several different x's correspond to the same y.
Now let's come up with an example where the dependency is not a function. Let's say these same guys told what specialties they applied for:

Here we have a completely different situation: one person can easily apply for one or several directions. That is one element sets are put in correspondence multiple elements sets. Respectively, it's not a function.
Let's test your knowledge in practice.
Determine from the pictures what is a function and what is not:

Got it? And here is answers:
- The function is - B,E.
- Not a function - A, B, D, D.
You ask why? Yes, here's why:

In all figures except AT) and E) there are several for one!
I am sure that now you can easily distinguish a function from a non-function, say what an argument is and what a dependent variable is, and also determine the scope of the argument and the scope of the function. Let's move on to the next section - how to define a function?
Ways to set a function
What do you think the words mean "set function"? That's right, it means explaining to everyone what function we are talking about in this case. Moreover, explain in such a way that everyone understands you correctly and the graphs of functions drawn by people according to your explanation were the same.
How can I do that? How to set a function? The easiest way, which has already been used more than once in this article - using a formula. We write a formula, and by substituting a value into it, we calculate the value. And as you remember, a formula is a law, a rule according to which it becomes clear to us and to another person how an X turns into a Y.
Usually, this is exactly what they do - in tasks we see ready-made functions defined by formulas, however, there are other ways to set a function that everyone forgets about, and therefore the question “how else can you set a function?” confuses. Let's take a look at everything in order, and start with the analytical method.
Analytical way of defining a function
The analytical method is the task of a function using a formula. This is the most universal and comprehensive and unambiguous way. If you have a formula, then you know absolutely everything about the function - you can make a table of values on it, you can build a graph, determine where the function increases and where it decreases, in general, explore it in full.
Let's consider a function. What does it matter?
"What does it mean?" - you ask. I'll explain now.
Let me remind you that in the notation, the expression in brackets is called the argument. And this argument can be any expression, not necessarily simple. Accordingly, whatever the argument (expression in brackets), we will write it instead in the expression.
In our example, it will look like this:
Consider another task related to the analytical method of specifying a function that you will have on the exam.
Find the value of the expression, at.
I'm sure that at first, you were scared when you saw such an expression, but there is absolutely nothing scary in it!
Everything is the same as in the previous example: whatever the argument (expression in brackets), we will write it instead in the expression. For example, for a function.
What should be done in our example? Instead, you need to write, and instead of -:
shorten the resulting expression:
That's all!
Independent work
Now try to find the meaning of the following expressions yourself:
- , if
- , if
Did you manage? Let's compare our answers: We are used to the fact that the function has the form
Even in our examples, we define the function in this way, but analytically it is possible to define the function implicitly, for example.
Try building this function yourself.
Did you manage?
Here's how I built it.
What equation did we end up with?
Correctly! Linear, which means that the graph will be a straight line. Let's make a table to determine which points belong to our line:
That's just what we were talking about ... One corresponds to several.
Let's try to draw what happened:

Is what we got a function?
That's right, no! Why? Try to answer this question with a picture. What did you get?

“Because one value corresponds to several values!”
What conclusion can we draw from this?
That's right, a function can't always be expressed explicitly, and what's "disguised" as a function isn't always a function!
Tabular way of defining a function
As the name suggests, this method is a simple plate. Yes Yes. Like the one we already made. For example:
Here you immediately noticed a pattern - Y is three times larger than X. And now the “think very well” task: do you think that a function given in the form of a table is equivalent to a function?
Let's not talk for a long time, but let's draw!
So. We draw a function given in both ways:

Do you see the difference? It's not about the marked points! Take a closer look:

Have you seen it now? When we set the function in a tabular way, we reflect on the graph only those points that we have in the table and the line (as in our case) passes only through them. When we define a function in an analytical way, we can take any points, and our function is not limited to them. Here is such a feature. Remember!
Graphical way to build a function
The graphical way of constructing a function is no less convenient. We draw our function, and another interested person can find what y is equal to at a certain x, and so on. Graphical and analytical methods are among the most common.
However, here you need to remember what we talked about at the very beginning - not every “squiggle” drawn in the coordinate system is a function! Remembered? Just in case, I'll copy here the definition of what a function is:
As a rule, people usually name exactly those three ways of specifying a function that we have analyzed - analytical (using a formula), tabular and graphic, completely forgetting that a function can be described verbally. Like this? Yes, very easy!
Verbal description of the function
How to describe the function verbally? Let's take our recent example - . This function can be described as "every real value of x corresponds to its triple value". That's all. Nothing complicated. Of course, you will object - “there are such complex functions that it is simply impossible to set verbally!” Yes, there are some, but there are functions that are easier to describe verbally than to set with a formula. For example: "each natural value of x corresponds to the difference between the digits of which it consists, while the largest digit contained in the number entry is taken as the minuend." Now consider how our verbal description functions are implemented in practice:
The largest figure in given number- , respectively, - reduced, then:
Main types of functions
Now let's move on to the most interesting - we will consider the main types of functions with which you worked / work and will work in the course of school and institute mathematics, that is, we will get to know them, so to speak, and give them brief description. Read more about each function in the corresponding section.
Linear function
A function of the form, where, are real numbers.
The graph of this function is a straight line, so the construction linear function is reduced to finding the coordinates of two points.
Direct position on coordinate plane depends on the slope factor.

Function scope (aka argument range) - .
The range of values is .
quadratic function
Function of the form, where
The graph of the function is a parabola, when the branches of the parabola are directed downwards, when - upwards.
Many properties of a quadratic function depend on the value of the discriminant. The discriminant is calculated by the formula
The position of the parabola on the coordinate plane relative to the value and coefficient is shown in the figure:

Domain
The range of values depends on the extremum of the given function (the vertex of the parabola) and the coefficient (the direction of the branches of the parabola)
Inverse proportionality
The function given by the formula, where
The number is called the inverse proportionality factor. Depending on what value, the branches of the hyperbola are in different squares:

Domain - .
The range of values is .
SUMMARY AND BASIC FORMULA
1. A function is a rule according to which each element of a set is assigned a unique element of the set.
- - this is a formula denoting a function, that is, the dependence of one variable on another;
- - variable, or, argument;
- - dependent value - changes when the argument changes, that is, according to some specific formula that reflects the dependence of one value on another.
2. Valid argument values, or the scope of a function, is what is related to the possible under which the function makes sense.
3. Range of function values- this is what values it takes, with valid values.
4. There are 4 ways to set the function:
- analytical (using formulas);
- tabular;
- graphic
- verbal description.
5. Main types of functions:
- : , where, are real numbers;
- : , where;
- : , where.
The derivative of a function $y = f(x)$ at a given point $x_0$ is the limit of the ratio of the increment of the function to the corresponding increment of its argument, provided that the latter tends to zero:
$f"(x_0)=(lim)↙(△x→0)(△f(x_0))/(△x)$
Differentiation is the operation of finding a derivative.
Table of derivatives of some elementary functions
| Function | Derivative |
| $c$ | $0$ |
| $x$ | $1$ |
| $x^n$ | $nx^(n-1)$ |
| $(1)/(x)$ | $-(1)/(x^2)$ |
| $√x$ | $(1)/(2√x)$ |
| $e^x$ | $e^x$ |
| $lnx$ | $(1)/(x)$ |
| $sinx$ | $cosx$ |
| $cosx$ | $-sinx$ |
| $tgx$ | $(1)/(cos^2x)$ |
| $ctgx$ | $-(1)/(sin^2x)$ |
Basic rules of differentiation
1. The derivative of the sum (difference) is equal to the sum (difference) of derivatives
$(f(x) ± g(x))"= f"(x)±g"(x)$
Find the derivative of the function $f(x)=3x^5-cosx+(1)/(x)$
The derivative of the sum (difference) is equal to the sum (difference) of the derivatives.
$f"(x) = (3x^5)"-(cos x)" + ((1)/(x))" = 15x^4 + sinx - (1)/(x^2)$
2. Derivative of a product
$(f(x) g(x))"= f"(x) g(x)+ f(x) g(x)"$
Find the derivative $f(x)=4x cosx$
$f"(x)=(4x)" cosx+4x (cosx)"=4 cosx-4x sinx$
3. Derivative of the quotient
$((f(x))/(g(x)))"=(f"(x) g(x)-f(x) g(x)")/(g^2(x)) $
Find the derivative $f(x)=(5x^5)/(e^x)$
$f"(x)=((5x^5)" e^x-5x^5 (e^x)")/((e^x)^2)=(25x^4 e^x- 5x^5 e^x)/((e^x)^2)$
4. The derivative of a complex function is equal to the product of the derivative of the external function and the derivative of the internal function
$f(g(x))"=f"(g(x)) g"(x)$
$f"(x)=cos"(5x) (5x)"=-sin(5x) 5= -5sin(5x)$
The physical meaning of the derivative
If a material point moves rectilinearly and its coordinate changes depending on time according to the law $x(t)$, then the instantaneous velocity of this point is equal to the derivative of the function.
The point moves along the coordinate line according to the law $x(t)= 1.5t^2-3t + 7$, where $x(t)$ is the coordinate at time $t$. At what point in time will the speed of the point be equal to $12$?
1. Speed is a derivative of $x(t)$, so let's find the derivative of the given function
$v(t) = x"(t) = 1.5 2t -3 = 3t -3$
2. To find at what point in time $t$ the speed was equal to $12$, we compose and solve the equation:
The geometric meaning of the derivative
Recall that the equation of a straight line not parallel to the coordinate axes can be written as $y = kx + b$, where $k$ is the slope of the straight line. The coefficient $k$ is equal to the tangent of the slope between the straight line and the positive direction of the $Ox$ axis.
The derivative of the function $f(x)$ at the point $x_0$ is equal to the slope $k$ of the tangent to the graph at the given point:
Therefore, we can make a general equality:
$f"(x_0) = k = tgα$
In the figure, the tangent to the function $f(x)$ is increasing, hence the coefficient $k > 0$. Since $k > 0$, then $f"(x_0) = tgα > 0$. The angle $α$ between the tangent and the positive direction $Ox$ is acute.
In the figure, the tangent to the function $f(x)$ is decreasing, hence the coefficient $k< 0$, следовательно, $f"(x_0) = tgα < 0$. Угол $α$ между касательной и положительным направлением оси $Ох$ тупой.
In the figure, the tangent to the function $f(x)$ is parallel to the $Ox$ axis, hence the coefficient $k = 0$, hence $f"(x_0) = tg α = 0$. The point $x_0$ at which $f "(x_0) = 0$, called extremum.
The figure shows the graph of the function $y=f(x)$ and the tangent to this graph drawn at the point with the abscissa $x_0$. Find the value of the derivative of the function $f(x)$ at the point $x_0$.
The tangent to the graph increases, therefore, $f"(x_0) = tg α > 0$
In order to find $f"(x_0)$, we find the tangent of the slope between the tangent and the positive direction of the $Ox$ axis. To do this, we complete the tangent to the triangle $ABC$.
Find the tangent of the angle $BAC$. (The tangent of an acute angle in a right triangle is the ratio of the opposite leg to the adjacent leg.)
$tg BAC = (BC)/(AC) = (3)/(12)= (1)/(4)=0.25$
$f"(x_0) = tg YOU = $0.25
Answer: $0.25
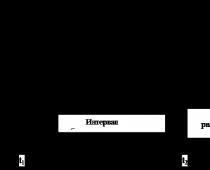
The derivative is also used to find the intervals of increasing and decreasing functions:
If $f"(x) > 0$ on an interval, then the function $f(x)$ is increasing on this interval.
If $f"(x)< 0$ на промежутке, то функция $f(x)$ убывает на этом промежутке.
The figure shows the graph of the function $y = f(x)$. Find among the points $х_1,х_2,х_3…х_7$ those points where the derivative of the function is negative.
In response, write down the number of data points.
Municipal educational institution
"Saltykovskaya secondary school
Rtishchevsky district of the Saratov region
Master class in mathematics
in 11th grade
on this topic
"DERIVATIVE FUNCTION
IN THE TASKS OF THE USE"
Conducted math teacher
Beloglazova L.S.
2012-2013 academic year
The purpose of the master class : to develop students' skills in applying theoretical knowledge on the topic "Derivative of a function" to solve problems of a single state exam.
Tasks
Educational: generalize and systematize students' knowledge on the topic
"The derivative of the function", to consider the prototypes of the USE problems on this topic, to provide students with the opportunity to test their knowledge while solving problems on their own.
Developing: promote the development of memory, attention, self-esteem and self-control skills; basic core competencies(comparison, comparison, classification of objects, determination of adequate methods for solving learning task on the basis of given algorithms, the ability to act independently in a situation of uncertainty, to control and evaluate their activities, to find and eliminate the causes of difficulties).
Educational: promote:
the formation of students' responsible attitude to learning;
development of a sustainable interest in mathematics;
creating positive intrinsic motivation to study mathematics.
Technology: individually differentiated learning, ICT.
Teaching methods: verbal, visual, practical, problematic.
Forms of work: individual, frontal, in pairs.
Equipment and materials for the lesson: projector, screen, PC for each student, simulator (Appendix No. 1), presentation for the lesson (Appendix No. 2), individually - differentiated cards for independent work in pairs (Appendix No. 3), list of Internet sites, individually differentiated homework (Appendix No. 4).
Explanation for the master class. This master class is held in grade 11 in order to prepare for the exam. Aimed at the application of theoretical material on the topic "Derivative of a function" in solving examination problems.
Duration of the master class- 30 minutes.
The structure of the master class
I. Organizational moment -1 min.
II. Communication of the topic, goals of the master class, motivation for educational activities-1 min.
III. Front work. Training "Assignments B8 USE". Analysis of work with the simulator - 6 min.
IV.Individually - differentiated work in pairs. Independent problem solving B14. Mutual check - 7 min.
V. Checking individual homework. Task with parameter C5 USE
3 min.
VI .On - line testing. Analysis of test results - 9 min.
VII. Individually differentiated homework -1 min.
VIII. Grades for the lesson - 1 min.
IX. Lesson summary. Reflection -1 min.
Master class progress
I .Organizing time.
II .Communication of the topic, goals of the master class, motivation of educational activities.
(Slides 1-2, Appendix No. 2)
The topic of our lesson is "The derivative of a function in the tasks of the exam." Everyone knows the saying "The spool is small and expensive." One of these "spools" in mathematics is the derivative. The derivative is used in solving many practical tasks mathematics, physics, chemistry, economics and other disciplines. It allows you to solve problems simply, beautifully, interestingly.
The topic "Derivative" is presented in the tasks of part B (B8, B14) of the unified state exam. Some C5 tasks can also be solved using a derivative. But to solve these problems, good mathematical preparation and non-standard thinking are required.
You have worked with the documents regulating the structure and content of the control measuring materials for the Unified State Examination in Mathematics 2013. Conclude thatwhat knowledge and skills do you need to successfully solve the problems of the exam on the topic "Derivative".
(Slides 3-4, Appendix No. 2)
We studied"Codifier content elements in MATHEMATICS for compiling control measuring materials for conducting a unified state exam”,
"Codifier of requirements for the level of training of graduates","Specification control measuring materials","Demo version"control measuring materials of the unified state exam 2013 "andfigured out what knowledge and skills about a function and its derivative are needed to successfully solve problems on the topic "Derivative".
Necessary
KNOW
P rules for calculating derivatives;
derivatives of basic elementary functions;
geometric and physical meaning of the derivative;
the equation of the tangent to the graph of the function;
investigation of a function with the help of a derivative.
BE ABLE TO
perform actions with functions (describe the behavior and properties of a function according to the graph, find its maximum and minimum values).
USE
acquired knowledge and skills in practical activities and everyday life.
You have theoretical knowledge on the topic "Derivative". Today we willLEARN TO APPLY KNOWLEDGE ABOUT THE DERIVATIVE FUNCTION FOR SOLVING THE PROBLEMS OF THE USE. ( Slide 4, application number 2)
After all, not without reason Aristotle said that “INTELLIGENCE CONSISTS NOT ONLY IN KNOWLEDGE, BUT ALSO IN THE ABILITY TO APPLY KNOWLEDGE IN PRACTICE”( Slide 5, application number 2)
At the end of the lesson, we will return to the goal of our lesson and find out if we have achieved it?
III . Front work. Training "Assignments B8 USE" (Annex No. 1) . Analysis of work with the simulator.
Choose the correct answer from the four given.
What, in your opinion, is the difficulty of completing task B8?
What do you think are the typical mistakes graduates make on the exam when solving this problem?
When answering the questions of task B8, you should be able to describe the behavior and properties of a function on the graph of the derivative, and on the graph of the function, the behavior and properties of the derivative of the function. And this requires good theoretical knowledge on the following topics: “Geometric and mechanical meaning of the derivative. Tangent to the graph of a function. Application of the derivative to the study of functions.
Analyze what tasks caused you difficulties?
What theoretical questions do you need to know?
IV. Individually - differentiated work in pairs. Independent problem solving B14. Mutual verification. (Appendix No. 3)
Recall the algorithm for solving problems (B14 USE) for finding extremum points, function extrema, the largest and smallest values of the function on the interval using the derivative.
Solve problems using the derivative.
The students were asked the following problem:
“Think about it, can some B14 problems be solved in a different way, without using a derivative?”
1 pair(Lukyanova D., Gavryushina D.)
1)B14. Find the minimum point of the function y \u003d 10x-ln (x + 9) + 6
2) B14.Find the largest value of a functiony =
- Try to solve the second problem in two ways.
2 pair(Saninskaya T., Sazanov A.)
1)B14.Find the smallest value of the function y=(x-10) on the segment
2) B14. Find the maximum point of the function y \u003d - ![]()
(Students defend their solution by writing down the main steps for solving problems on the board. Students of 1 pair (Lukyanova D., Gavryushina D.) provide two ways to solve problem #2).
Solution of a problem. Conclusion to be drawn by students:
“Some B14 USE problems on finding the smallest and largest values of a function can be solved without using a derivative, based on the properties of functions.”
Analyze what mistake you made in the task?
What theoretical questions do you need to repeat?
V. Checking individual homework. Task with parameter C5(USE) ( Slides 7-8, Appendix #2)
Lukyanova K. was given an individual homework assignment: choose a problem with the parameter (C5) from the manuals for preparing for the exam and solve it using the derivative.
(The student gives a solution to the problem, based on the functional-graphic method, as one of the methods for solving problems C5 USE and gives short explanation this method).
What knowledge about the function and its derivative is necessary when solving C5 USE problems?
V I. On - line testing for tasks B8, B14. Analysis of test results.
Site for testing in the lesson:
Who didn't make mistakes?
Who experienced difficulty in testing? Why?
What tasks are wrong?
Conclude what theoretical questions you need to know?
VI I. Individually differentiated homework
(Slide 9, application number 2), (Appendix No. 4).
I have prepared a list of Internet sites to prepare for the exam. You can also browse these sitesn – linetesting. For the next lesson, you need to: 1) repeat theoretical material on the topic "Derivative of a function";
2) on the site "Open bank of assignments in mathematics" ( ) find prototypes of tasks B8 and B14 and solve at least 10 tasks;
3) Lukyanova K., Gavryushina D. solve problems with parameters. The rest of the students solve problems 1-8 (option 1).
VIII. Lesson grades.
What grade would you give yourself for the lesson?
Do you think you could do better in class?
IX. Summary of the lesson. Reflection
Let's summarize our work. What was the purpose of the lesson? Do you think it has been achieved?
Look at the board and in one sentence, choosing the beginning of the phrase, continue the sentence that suits you best.
I felt…
I learned…
I managed …
I was able...
I'll try …
I was surprised that …
I wanted…
Can you say that during the lesson there was an enrichment of your stock of knowledge?
So you repeated the theoretical questions about the derivative of a function, applied their knowledge in solving prototypes of USE tasks (B8, B14), and Lukyanova K. completed task C5 with a parameter, which is a task of an increased degree of complexity.
I enjoyed working with you and I hope that you will be able to successfully apply the knowledge gained in mathematics lessons not only in passing the exam but also in further studies.
I would like to end the lesson with the words of an Italian philosopher Thomas Aquinas“Knowledge is such a precious thing that it is not shameful to obtain it from any source” (Slide 10, Appendix No. 2).
I wish you success in preparing for the exam!
EXTRA-CURRICULUM PRACTICAL WORK 2
Transformation of graphs of functions.
Target
Plot function graphs using various transformations, answer the question of the problem.
Completing of the work
The work is designed for 10 options, the option number matches the last digit of the serial number in the list. For example, 1, 11, 21, 31 ... perform 1 option, 2,12, 22 ... - 2 option, etc.
The work consists of two parts: the first part of tasks 1 - 5, these are tasks that must be completed in order to get credit, if these tasks are completed with an error, you need to correct them and submit the work again for verification. The second part contains tasks, by completing which you can earn an additional grade: the main part +2 tasks - "4", the main part +3 tasks - "5".
Task 1. The graph of a linear function is a straight line; two points are enough to construct it. (we take the values of the argument x arbitrarily, and consider substituting the value of the function y into the formula).
To check whether the graph of the function passes through the specified point, you need to substitute the coordinates of the point instead of x and y, if you get the correct equality, then the line passes through the specified point, otherwise it does not pass.
Task 2, 3, 4. The graphs of the indicated functions are obtained from the graphs of the functions , using a shift along the x or y axis.
![]() , first plot the function or , then we shift it by “a” units to the right or left (+ a - to the left, - a to the right), then we shift it by “b” units up or down (+ in - up, - in - down)
, first plot the function or , then we shift it by “a” units to the right or left (+ a - to the left, - a to the right), then we shift it by “b” units up or down (+ in - up, - in - down)
Similarly with other functions:
Task 5 To plot a function graph: , you need to: 1) build a graph of the function , 2) the part of the graph that is above the x-axis is left unchanged, 3) the part of the graph that is below the x-axis is mirrored.
Tasks for independent solution.
Task 1. Plot a graph of a linear function, determine if the graph of the function passes through the specified point:

Task 2. Plot a graph of a quadratic function, indicate the set of values for this function.

Task 3. Build a graph of a function, determine whether the specified function is increasing or decreasing.

Task 4. Build a graph of the function, answer the question of the task.

Task 5. Build a graph of a function containing the sign of the modulus.

Tasks for additional assessment.
Task 6. Plot a graph of a function given piecewise, determine if this function has a break point:


Task 7. Determine how many solutions the system of equations has, justify the answer. Draw conclusions by answering the questions.
What functions graphs did you build in this work?
What is the name of the graph of a linear function?
What is the name of the graph of a quadratic function?
What chart transformations do you know?
How the graph is located in the coordinate system even function? Graph of an odd function?
- In contact with 0
- Google Plus 0
- OK 0
- Facebook 0